AI-generated ad images matched or beat human-made ones on clicks in the studies we found, most clearly where a system selected and tested them. In a live Instagram campaign, AI images picked by a trained model and checked for brand fit got a 0.98% click-through rate against a human designer's 0.65%, per INFORMS's release on a 2026 Marketing Science paper: one brand, one designer. A separate native-ads study found AI images people did not judge AI-made averaged more clicks, a correlation, not a tested cause. Syracuse University's Newhouse School reported that human-made video ads scored higher on predicted sales. The useful decision is how to build the testing system around AI.
On 29 July 2026 Meta said over 9 million small businesses use at least one of its AI creative tools, and Google set September for moving more Search campaigns to its AI Max automation. Meta and Google switch some AI creative features on by default, and your team still decides what gets tested and what ships.
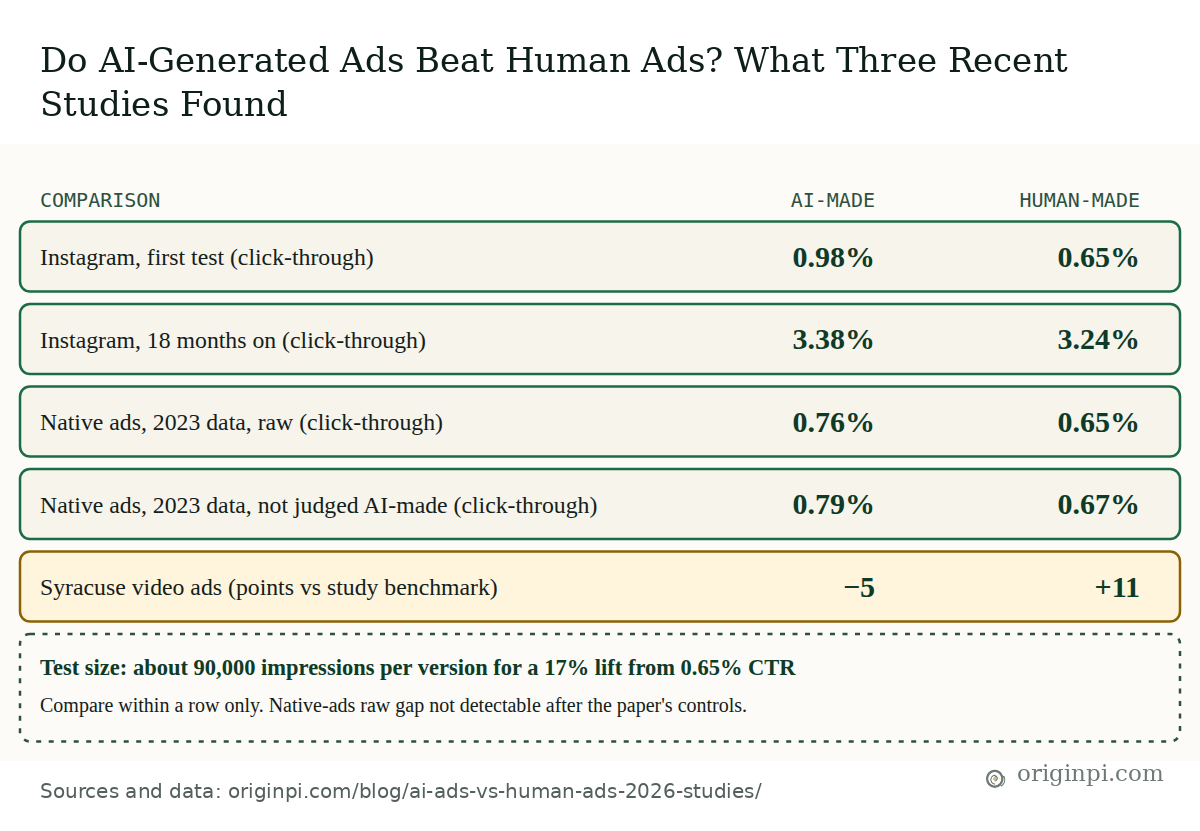
At a glance: AI-made ads against human-made ads in three recent studies
Average results as reported. The studies differ in setup, so compare within a row only.
What did the three recent studies find?
Three studies published or revised in 2026 give a split answer. A Marketing Science paper and a working paper by German and US business-school researchers found AI ad images had higher raw average click-through than human ones. A Syracuse University test found human-made video ads stronger on predicted sales. The Syracuse test used US respondents, and the other two do not report audience markets in the sources we read, so run the pre-sized test below in your own market.
The two click studies use field click data, though the native-ads paper also collected judgments of whether images looked AI-made. The Marketing Science paper by Remi Daviet and Yohei Nishimura (published online May 2026) ran a live Instagram campaign for an outdoor-activities company. Its system generated background images, used an active-learning engine to predict which would get clicks, and the designs were vetted for brand standards. The numbers come from INFORMS's release of 4 August 2026, not the paywalled paper: the AI set averaged 0.98% CTR against 0.65% for a professional designer, and was still slightly ahead 18 months later, 3.38% to 3.24%, with no retraining. The release does not say whether that later gap is statistically meaningful.
The second is the "AI in Disguise" working paper by Yannick Exner, Jochen Hartmann, Oded Netzer and Shunyuan Zhang, built on data from the display-ad platform Taboola. It compared 4,633 "sibling ads", AI and human images run by the same advertiser in the same campaign on the same day, across 369 million impressions. Raw CTR was 0.76% for AI against 0.65% for human. After controls, the authors found no detectable average disadvantage for AI.
Click-through rate
AI images had the higher raw average CTR in all three comparisons
Mean CTR, %. The studies differ in setup, so compare within a row, not across rows. The first Instagram gap is the largest. The native-ads raw gap disappears after the paper's controls, and the release does not say whether the 18-month Instagram gap is meaningful.
Instagram first test: AI 0.98%, human designer 0.65%. Instagram 18 months later: AI 3.38%, human 3.24%. Native ads (2023 data), raw averages: AI 0.76%, human 0.65%.
| Comparison | AI-generated | Human-made |
|---|---|---|
| Instagram, first test | 0.98% | 0.65% |
| Instagram, 18 months on | 3.38% | 3.24% |
| Native ads, 2023 data (AI in Disguise), raw | 0.76% | 0.65% |
The third study measured something different. Syracuse University's Newhouse School reported in May 2026, in work done with the research firm Ipsos, that it paired 10 human-made ads made before 2021 with fully AI-generated versions built from the same brief, 20 ads across 10 brands, and showed them to 3,000 US respondents. That is a different test from a tuned image pipeline, so it sits on its own scale below.
Predicted sales effect, separate scale
Human video ads beat the benchmark; AI versions fell short
Points above or below the study's sales-validated benchmark. Not a click-through rate: do not compare with the chart above.
Human-made ads scored 11 points above the study's benchmark on average; AI-made ads scored 5 points below.
| Ad type | Points vs benchmark |
|---|---|
| Human-made ads | +11 |
| AI-made ads | −5 |
Each study answers a narrower question than its headline. The cards below set out each study's method and its main limit.
Marketing Science, Daviet and Nishimura (2026)
Setting: live Instagram campaign, one outdoor-activities company; AI generated background images, an active-learning engine predicted which would get clicks; designs were vetted for brand standards.
Result (per INFORMS's release): AI 0.98% CTR vs designer 0.65% and an aesthetics-only AI 0.78%. Eighteen months later, 3.38% vs 3.24%.
Limit: one brand, one format, one designer. The release gives no impression counts, and the full paper is paywalled.
AI in Disguise, Exner et al.
Setting: native display ads, June to August 2023; images from the platform's AI ad maker (Stable Diffusion 2 in the paper's January 2025 version).
Result: 4,633 sibling ads, 369 million impressions. Raw CTR 0.76% AI vs 0.65% human; no detectable average disadvantage after controls; AI images that did not look AI had the highest average CTR, a correlation.
Limit: data from one platform; 2023 image models; clicks only; whether an image looks AI-made is an observed association, not a tested cause.
Syracuse University, Newhouse School (May 2026)
Setting: 10 human-made ads and 10 AI versions, 20 ads across 10 brands, shown to 3,000 US respondents.
Method: human originals made before 2021 so AI tools were not used; the AI versions were fully AI-generated from the same strategic brief.
Result: human ads 11 points above the study's benchmark, AI ads 5 below. The release says AI did best on straightforward, product-driven briefs and struggled with storytelling or emotion.
Limit: predicted effect from a sales-validated survey measure, not live sales; 10 pairs; the ads were fully AI-generated, so this is not a human-plus-AI workflow.
Where did AI ads do well and badly in these studies?
AI ad images did best in these studies when something selected them: a model trained on live results, a brand screen, a test. In the native-ads data, AI images that people did not judge AI-made averaged 0.79% CTR, the highest of four groups, while AI images that looked AI averaged 0.62%. Human images show the same pattern, 0.67% against 0.55%, so looking AI-made goes with lower clicks for both. That is a correlation in observational data, not proof that looking AI causes fewer clicks.
The selection effect is the quiet part of the Instagram result. The system generated many candidates, learned from clicks which ones worked, and the designs were vetted for brand standards. The comparison was a professional designer's creatives.
That is a fair test of one process against one designer for one brand, and the release gives no sample size.
Looks AI or not
AI images not judged AI-made had the highest average CTR
Mean CTR, %, by who made the image and whether people judged it AI-made. Model-free averages, native-ads data, 2023.
AI images that did not look AI: 0.79%. AI images that looked AI: 0.62%. Human images that did not look AI: 0.67%. Human images that looked AI: 0.55%.
| Image made by | Does not look AI | Looks AI |
|---|---|---|
| AI | 0.79% | 0.62% |
| Human | 0.67% | 0.55% |
What made an image read as human? Higher aesthetic quality, realism and medium to large faces. Vivid colour, warm tones and text in the image read as AI. The paper also found that more than 45% of the AI ads were judged definitely or likely human-made.
So "make it look less AI" is a reasonable hypothesis to test: natural colour, a prominent face and no text in the image.
Video is harder. The Syracuse release says AI did best on straightforward, product-driven briefs and struggled when the brief called for storytelling or emotion; its strongest result was the Cheerios pairing, where a deeply human brief produced the highest scores across both versions. With 10 pairs, and ads that differ in more than storytelling, the test cannot separate storytelling from format or editing differences. Keep a human-made control in video tests.
Can people spot an AI ad?
Few viewers were confident either way. In the Syracuse study, only 13% of viewers who saw an AI-made ad were at least somewhat confident it was AI, the same share as for human-made ads, and 40% of all viewers were unsure either way.
Try it yourself. We made four pairs of ads for fictional brands. In each pair one photo is AI-generated and one is a real photograph, set in the same layout.
Spot the AI ad
Which photo did AI make?
Four pairs. Each pair has the same brand and copy, in the same layout. Pick the ad whose photo you think is AI-generated.
These are illustrative ads made by Origin Pi for this quiz, not real campaigns or real brands. In each pair one photo was generated by AI (Google's Nano Banana Pro) and the other is a real public-domain (CC0) photograph; photos were resized, never cropped. For the real-world figure, see the Syracuse finding that only 13% of AI-ad viewers were at least somewhat confident it was AI. Nothing you pick leaves your browser.
Not spotting AI does not mean not caring, and labelling rules now differ by market. Our map of AI ad labelling rules for Q4 2026 covers where a label is required. This is general information, not legal advice. A label is not a defence for a false claim, which is why AI copy still needs the claims check we described in September.
What are the big ad platforms already automating?
The big ad platforms now automate targeting and bidding by default; Meta and Google switch on some AI creative features, TikTok's are optional. Meta said on 29 July 2026 that over 9 million small businesses use at least one of its AI creative tools. Google said it would move eligible Search campaigns to AI Max during September 2026 (check yours), and its AI Max help page says each feature can be switched off.
The platform performance claims are the platforms' own. Meta's CFO Susan Li told investors that model changes, "combined with our GEM model for ads ranking", produced "an 8.3% increase in ad clicks and a 15.7% uplift in conversions on Facebook". Google says AI Max campaigns using all its features see "an average of 7% more conversions or conversion value at a similar CPA/ROAS" compared with using search term matching alone (Google internal data, non-Retail advertisers). Neither is an independent test, so treat them as reasons to run your own.
Platform automation
Where the platforms already automate, and what you can switch off
What each platform's own pages said when we read them on 4 October 2026. Not stated means not stated in the pages we read.
| What happens | Meta Advantage+ | Google AI Max | Google PMax | TikTok Smart+ |
|---|---|---|---|---|
| AI runs targeting and delivery | Audience, placement, budget | Search term matching | All Google channels | Targeting; budget to top creative |
| AI writes or changes creative | Some enhancements on | Text customisation | Text, URL, video settings | Optional creative AI |
| Creative AI can be turned off | Yes, any time | Yes, per feature | Yes, campaign settings | Yes, any time |
| AI picks the landing page | Not stated | Final URL expansion | Final URL expansion, if on | Not stated |
| Existing campaigns moved for you | Not stated | From Sep 2026 (DSA 2027) | Not stated | Not stated |
Key: automated by default or on · optional or partly on · not stated in the pages we read
Sources: Meta Advantage+ and Advantage+ creative pages; Google Ads Help on AI Max and Performance Max; TikTok Ads Manager help on Smart+; Google blog, updated 11 June 2026. LinkedIn Accelerate is left out: we could not read a current LinkedIn help page describing it. Settings change often; check your own account.
One line in Google's Performance Max help deserves a place in every brief: "you remain responsible for reviewing and ensuring compliance and accuracy of landing page content, and all dynamically generated assets." The platform writes the variant. You own the claim.
How many impressions do you need to call a winner?
An ad creative test needs far more impressions than most teams give it. With the standard two-proportion formula at 95% confidence and 80% power, detecting a 20% lift from a 1% click-through rate takes about 43,000 impressions per version. Detecting a 10% lift from 0.5% takes about 328,000. Small gaps on low click rates need big samples. These numbers size a click test; a test on conversions needs far more traffic. For more than two versions, or if you peek at results before the end, the figures are too low.
That matters for reading the studies too. The Instagram follow-up gap, 3.38% against 3.24%, is a lift of about 4%. Our calculator puts that at about 260,000 impressions per version before a test could reliably detect it. The release does not give the sample, so we cannot say whether the follow-up had one that size.
The table below gives impressions per version for common starting points, at 95% confidence and 80% power, rounded to the nearest thousand.
| Baseline CTR | Detect a 10% lift | Detect a 20% lift | Detect a 30% lift |
|---|---|---|---|
| 0.5% | 328,000 | 86,000 | 40,000 |
| 1% | 163,000 | 43,000 | 20,000 |
| 2% | 81,000 | 21,000 | 10,000 |
| 3.3% | 48,000 | 13,000 | 6,000 |
Illustrative example: your human-made ads run at 0.65% CTR, the human average in the native-ads data, and you want to know whether AI variants lift that by 17%, to about 0.76%, the raw gap that study saw. You need about 90,000 impressions per version, so about 180,000 in total. At a made-up 10,000 impressions a day across both versions, that takes just over 18 days, so plan 19. Stop on day five because AI is ahead, and you have probably read noise.
A/B test calculator
How many impressions does each ad version need?
Each version needs enough impressions to tell a real lift from noise; enter your numbers to see how many. Impressions per version = (zα × √(2m(1 − m)) + zβ × √(p1(1 − p1) + p2(1 − p2)))² ÷ (p2 − p1)², where p1 is your current CTR, p2 the CTR you want to detect, m their average, zα set by confidence and zβ by power. Days = both versions' impressions ÷ your daily impressions.
Two-sided test, two versions, even split. Presets: Native-ads human average 0.65% with a 17% lift; Instagram 18-month test 3.24% with a 4.3% lift; Instagram first test 0.65% with a 51% lift. z values use a standard approximation, within 1% of exact for these ranges. The daily impressions default is illustrative, not measured data. Nothing you enter leaves your browser.
How do you run AI creative testing without losing the brand?
Run AI creative as a six-step system in which people set the idea, AI adds volume and a pre-sized test picks the winner. Between those sit a brand and claims gate, a read of sales as well as clicks, and a rule for scaling. The gate and the pre-sized test are the two steps most teams skip.
A creative-testing system: people set the idea, AI adds volume, tests decide
Six steps, one loop. Our recommended design, not a measured process.
Who owns what follows from that. Owners and CMOs decide where human craft stays, which means concept and story, where the Syracuse release says AI struggled. Performance leads treat test traffic as the constraint, because variants are cheap: fix the impressions before launch and change one thing at a time. Compliance reviews every AI variant, because Google's Performance Max help says the advertiser stays responsible for generated assets; switch off features that write copy after your gate for regulated claims. Technical leads build the gate: a brand check on images, a claims check on copy and a log of what shipped.
Read results on the metric the business needs. A click win on a static image does not tell you an AI video will sell. Where the format is video or the brief is emotional, keep a human-made control in every test.
Where Origin Pi stands
The six-step system above is our design, built on a cautious reading of three studies; it is not a finding of any of them. The reading is that AI creative did well on clicks where a system selected and tested it, and that human-made video scored higher on predicted sales against fully AI-generated ads.
We design and build that system for marketing teams. Agents generate variants from an approved concept and an evidence register, a confirm step routes anything with a new claim to a named approver, and every variant that ships lands in an audit trail with its test result. Bounded permissions mean the agent can draft and queue, not publish. It is the core of our marketing AI work.
For the media side, Origin Pi's marketing consultancy brand leapbuzz offers paid social, including on Meta and TikTok.
Your first move: take your next creative test, write down the current CTR and the smallest lift worth acting on, and run the calculator above. If the answer is more traffic than you will buy, test bigger differences or fewer versions before you add more AI variants.
Take the data with you
Every figure in this post's charts, at-a-glance card and sample-size table is in one table, with its source and source date, plus the date we read it. If you reuse either file, please cite this post and link back to it.
Next step
Build the testing system, then buy the media
Origin Pi
Creative pipeline automation
AI variant generation with a brand and claims gate, plus approvals and an audit trail of what shipped.
Discuss a creative pipelineleapbuzz
AI creative testing and paid social
Get a creative-testing plan for your paid social channels from Origin Pi's marketing consultancy brand leapbuzz.
Get a creative-testing plan